Indicator Gauge Icon Legend
Legend Colors
Red is bad, green is good, blue is not statistically different/neutral.
Compared to Distribution
 the value is in the best half of communities.
 the value is in the 2nd worst quarter of communities.
 the value is in the worst quarter of communities.
Compared to Target
 meets target;
  does not meet target.
Compared to a Single Value
 lower than the comparison value;
 higher than the comparison value;
 not statistically different from comparison value.
Trend

 non-significant change over time;
 significant change over time;
  no change over time.
Compared to Prior Value
 higher than the previous measurement period;
 lower than the previous measurement period;
 no statistically different change from previous measurement period.
 Significantly better than the overall value
 Significantly worse than the overall value
 No significant difference with the overall value
 No data on significance available
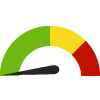
Adults who were Injured in a Fall: 45+
County: Morris
Measurement Period: 2020
This indicator is archived and is no longer being updated. Click to learn more
This indicator shows the percent of older adults aged 45 and over who were injured in a fall in the past year.
Why is this important?
The risk of unintentional falls increases with age, and the National Institutes of Health (NIH) estimates that around 1 in 3 adults aged 65 years and older falls each year. Many falls result in emergency department visits and hospitalizations, fractures, and trauma, and the impact of these injuries resulting from unintentional falls on the quality of life is enormous. Interventions that reduce the risk of seniors falling will yield significant public health benefits.
Clear this location
County: Morris
5.5%
Source:
State of New Jersey Department of Health
Measurement period: 2020
Maintained by: Conduent Healthy Communities Institute
Last update: July 2022
Measurement period: 2020
Maintained by: Conduent Healthy Communities Institute
Last update: July 2022
Compared to
More details:
The NJBRFS dataset for 2018 is incomplete. There are no 2019 NJBRFS data due to data collection issues.
Graph Selections
No significant difference with the overall value

| County | Source | Measurement Period | Percent | |
|---|---|---|---|---|
There are 5 County values. The lowest value is 4.4%, and the highest value is 11%.
Half of the values are between 4.4% and 5.5%.
The middle (median) value is 5.5%.
Data Source
- State of New Jersey Department of Health
Maintained By: Conduent Healthy Communities Institute (Methodology)
Filed under: Health / Older Adults, Health / Prevention & Safety, Health Outcomes, Adults, Older Adults