Advanced Search: Build a Custom Dashboard
In the fields below, search for indicators by location, topics, population, classification, subgroup, or comparison. No fields are required, but we suggest selecting a location or two to start. In the additional search options section, select options to group and order search results. To learn more about how to customize a dashboard, see our help center.
Visit the Indicator List Page to see the full list of indicators and locations available on the site.
Search Results:
Indicator Gauge Icon Legend
Legend Colors
Red is bad, green is good, blue is not statistically different/neutral.
Compared to Distribution
 the value is in the best half of communities.
 the value is in the 2nd worst quarter of communities.
 the value is in the worst quarter of communities.
Compared to Target
 meets target;
  does not meet target.
Compared to a Single Value
 lower than the comparison value;
 higher than the comparison value;
 not statistically different from comparison value.
Trend

 non-significant change over time;
 significant change over time;
  no change over time.
Compared to Prior Value
 higher than the previous measurement period;
 lower than the previous measurement period;
 no statistically different change from previous measurement period.
Health / Alcohol & Drug Use
Health / Alcohol & Drug Use
County: Morris
Value
Compared to:
County: Morris Adults who Binge Drink
County: Morris Adults who Binge Drink
16.1%
(2021)
Compared to:
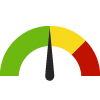

NJ Counties
The distribution is based on data from 21 New Jersey counties.
NJ Value
(15.7%)
The regional value is compared to the New Jersey State value.
US Value
(15.4%)
The regional value is compared to the national value. The source for the national value is Behavioral Risk Factor Surveillance System
Prior Value
(13.8%)
Prior Value compares a measured value with the previously measured value. Confidence intervals were taken into account in determining the direction of the comparison.
Trend
This comparison measures the indicator’s values over multiple time periods.<br>The Mann-Kendall Test for Statistical Significance is used to evaluate the trend<br>over 4 to 10 periods of measure, subject to data availability and comparability.
County: Morris Adults who Drink Excessively
County: Morris Adults who Drink Excessively
18.5%
(2021)
Compared to:
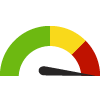
NJ Counties
The distribution is based on data from 21 New Jersey counties.
U.S. Counties
The distribution is based on data from 3,141 U.S. counties and county equivalents.
NJ Value
(16.8%)
The regional value is compared to the New Jersey State value.
US Value
(18.1%)
The regional value is compared to the national value.
Prior Value
(20.0%)
Prior Value compares a measured value with the previously measured value. Confidence intervals were taken into account in determining the direction of the comparison.
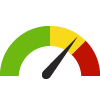
County: Morris Adults who Use Alcohol: Past 30 Days
County: Morris Adults who Use Alcohol: Past 30 Days
69.4%
(2021)
Compared to:

NJ Counties
The distribution is based on data from 21 New Jersey counties.
NJ Value
(56.8%)
The regional value is compared to the New Jersey State value.
Prior Value
(62.6%)
Prior Value compares a measured value with the previously measured value. Confidence intervals were taken into account in determining the direction of the comparison.
Trend
This comparison measures the indicator’s values over multiple time periods.<br>The Mann-Kendall Test for Statistical Significance is used to evaluate the trend<br>over 4 to 10 periods of measure, subject to data availability and comparability.
County: Morris Age-Adjusted Drug and Opioid-Involved Overdose Death Rate
County: Morris Age-Adjusted Drug and Opioid-Involved Overdose Death Rate
21.2
Deaths per 100,000 population
(2018-2020)
Compared to:
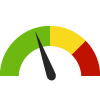
NJ Counties
The distribution is based on data from 21 New Jersey counties.
U.S. Counties
The distribution is based on data from 1,303 U.S. counties and county equivalents.
NJ Value
(32.3)
The regional value is compared to the New Jersey State value.
US Value
(23.5)
The regional value is compared to the national value.
Prior Value
(22.2)
Prior Value compares a measured value with the previously measured value. Confidence intervals were taken into account in determining the direction of the comparison.
14.1
Age-Adjusted Rate per 10,000 population
(2014)
Compared to:
NJ Value
(25.56)
The regional value is compared to the average rate for New Jersey Counties.
Prior Value
(19.5)
Prior Value compares a measured value with the previously measured value. Confidence intervals were not taken into account in determining the direction of the comparison.
County: Morris Alcohol-Impaired Driving Deaths
County: Morris Alcohol-Impaired Driving Deaths
17.2%
Percent of driving deaths with alcohol involvement
(2017-2021)
Compared to:
NJ Counties
The distribution is based on data from 21 New Jersey counties.
U.S. Counties
The distribution is based on data from 3,116 U.S. counties and county equivalents.
NJ Value
(22.9%)
The regional value is compared to the New Jersey State value.
US Value
(26.3%)
The regional value is compared to the national value.
Prior Value
(15.3%)
Prior Value compares a measured value with the previously measured value. Confidence intervals were taken into account in determining the direction of the comparison.
Trend
This comparison measures the indicator’s values over multiple time periods.<br>The Mann-Kendall Test for Statistical Significance is used to evaluate the trend<br>over 4 to 10 periods of measure, subject to data availability and comparability.
County: Morris Death Rate due to Drug Poisoning
County: Morris Death Rate due to Drug Poisoning
19.9
Deaths per 100,000 population
(2019-2021)
Compared to:
NJ Counties
The distribution is based on data from 21 New Jersey counties.
U.S. Counties
The distribution is based on data from 1,899 U.S. counties and county equivalents.
NJ Value
(32.2)
The regional value is compared to the New Jersey State value.
US Value
(27.2)
The regional value is compared to the national value.
HP 2030 Target
(20.7)
<div>SU-03: Reduce drug overdose deaths <strong>(LEADING HEALTH INDICATOR)</strong></div>
County: Morris Health Behaviors Ranking
County: Morris Health Behaviors Ranking
1
(2023)
Compared to:
NJ Counties
The distribution is based on data from 21 New Jersey counties.
County: Morris Hepatitis C Cases
County: Morris Hepatitis C Cases
221.0
(2015)
Compared to:

Prior Value
(211.0)
Prior Value compares a measured value with the previously measured value. Confidence intervals were not taken into account in determining the direction of the comparison.
County: Morris Liquor Store Density
County: Morris Liquor Store Density
18.8
Stores per 100,000 population
(2021)
Compared to:

NJ Counties
The distribution is based on data from 21 New Jersey counties.
U.S. Counties
The distribution is based on data from 1,477 U.S. counties and county equivalents.
NJ Value
(19.5)
The regional value is compared to the New Jersey State value.
US Value
(10.7)
The regional value is compared to the national value.
Prior Value
(18.7)
Prior Value compares a measured value with the previously measured value. Confidence intervals were not taken into account in determining the direction of the comparison.
Trend
This comparison measures the indicator’s values over multiple time periods.<br>The Mann-Kendall Test for Statistical Significance is used to evaluate the trend<br>over 4 to 10 periods of measure, subject to data availability and comparability.
County: Morris Liver and Bile Duct Cancer Incidence Rate
County: Morris Liver and Bile Duct Cancer Incidence Rate
7.0
Cases per 100,000 population
(2016-2020)
Compared to:
NJ Counties
The distribution is based on data from 21 New Jersey counties.
U.S. Counties
The distribution is based on data from 1,355 U.S. counties and county equivalents.
NJ Value
(8.0)
The regional value is compared to the New Jersey State value.
US Value
(8.6)
The regional value is compared to the national value.
Prior Value
(6.8)
Prior Value compares a measured value with the previously measured value. Confidence intervals were taken into account in determining the direction of the comparison.
Trend
This comparison measures the indicator’s values over multiple time periods.<br>The Mann-Kendall Test for Statistical Significance is used to evaluate the trend<br>over 4 to 10 periods of measure, subject to data availability and comparability.
County: Morris Opioid Treatment Admission Rate
County: Morris Opioid Treatment Admission Rate
133.6
Admissions per 100,000 population
(2022)
Compared to:
NJ Counties
The distribution is based on data from 21 New Jersey counties.
NJ Value
(404.7)
The regional value is compared to the New Jersey State value.
Prior Value
(188.5)
Prior Value compares a measured value with the previously measured value. Confidence intervals were not taken into account in determining the direction of the comparison.
Trend
This comparison measures the indicator’s values over multiple time periods.<br>The Mann-Kendall Test for Statistical Significance is used to evaluate the trend<br>over 4 to 10 periods of measure, subject to data availability and comparability.
