Advanced Search: Build a Custom Dashboard
In the fields below, search for indicators by location, topics, population, classification, subgroup, or comparison. No fields are required, but we suggest selecting a location or two to start. In the additional search options section, select options to group and order search results. To learn more about how to customize a dashboard, see our help center.
Visit the Indicator List Page to see the full list of indicators and locations available on the site.
Search Results:
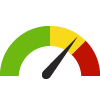
Indicator Gauge Icon Legend
Legend Colors
Red is bad, green is good, blue is not statistically different/neutral.
Compared to Distribution
 the value is in the best half of communities.
 the value is in the 2nd worst quarter of communities.
 the value is in the worst quarter of communities.
Compared to Target
 meets target;
  does not meet target.
Compared to a Single Value
 lower than the comparison value;
 higher than the comparison value;
 not statistically different from comparison value.
Trend

 non-significant change over time;
 significant change over time;
  no change over time.
Compared to Prior Value
 higher than the previous measurement period;
 lower than the previous measurement period;
 no statistically different change from previous measurement period.
Health / Maternal, Fetal & Infant Health
Health / Maternal, Fetal & Infant Health
County: Morris
Value
Compared to:
County: Morris Babies with Low Birthweight
County: Morris Babies with Low Birthweight
6.7%
(2021)
Compared to:
NJ Counties
The distribution is based on data from 21 New Jersey counties.
NJ Value
(7.7%)
The regional value is compared to the New Jersey State value.
US Value
(8.5%)
The regional value is compared to the national value. The source for the national value is Centers for Disease Control and Prevention
Prior Value
(6.5%)
Prior Value compares a measured value with the previously measured value. Confidence intervals were taken into account in determining the direction of the comparison.
Trend
This comparison measures the indicator’s values over multiple time periods.<br>The Mann-Kendall Test for Statistical Significance is used to evaluate the trend<br>over 4 to 10 periods of measure, subject to data availability and comparability.
NJ 2020
(7.7%)
<div><span>Babies born with a low birth weight are more likely than babies of normal weight to require specialized medical care, and often must stay in the intensive care unit. Low birth weight is often associated with premature birth. While there have been many medical advances enabling premature infants to survive, there is still risk of infant death or long-term disability. The most important things an expectant mother can do to prevent prematurity and low birth weight are to take prenatal vitamins, stop smoking, stop drinking alcohol and using drugs, and most importantly, get prenatal care.</span></div>
County: Morris Babies with Very Low Birthweight
County: Morris Babies with Very Low Birthweight
0.8%
(2021)
Compared to:
NJ Counties
The distribution is based on data from 21 New Jersey counties.
NJ Value
(1.2%)
The regional value is compared to the New Jersey State value.
US Value
(1.4%)
The regional value is compared to the national value. The source for the national value is Centers for Disease Control and Prevention
Prior Value
(0.9%)
Prior Value compares a measured value with the previously measured value. Confidence intervals were taken into account in determining the direction of the comparison.
Trend
This comparison measures the indicator’s values over multiple time periods.<br>The Mann-Kendall Test for Statistical Significance is used to evaluate the trend<br>over 4 to 10 periods of measure, subject to data availability and comparability.
NJ 2020
(1.4%)
<div><span>Babies born with a very low birth weight are more likely than babies of normal weight to require specialized medical care and often must stay in intensive care nurseries. Low birth weight is often associated with premature birth. Babies born at very low birth weight are at the highest risk of dying in their first year. While there have been many medical advances enabling very low birth weight and premature infants to survive, there is still risk of infant death or long-term disability. To prevent prematurity and low birth weight, expectant mothers should take prenatal vitamins, stop smoking, stop drinking alcohol and using drugs, and most importantly, get prenatal care.</span></div>
County: Morris Infant Mortality Rate
County: Morris Infant Mortality Rate
2.6
Deaths per 1,000 live births
(2019-2021)
Compared to:
NJ Value
(4.0)
The regional value is compared to the New Jersey State value.
US Value
(5.4 in 2021)
The regional value is compared to the national value. The source for the national value is Centers for Disease Control and Prevention
Prior Value
(2.9)
Prior Value compares a measured value with the previously measured value. Confidence intervals were taken into account in determining the direction of the comparison.
Trend
This comparison measures the indicator’s values over multiple time periods.<br>The Mann-Kendall Test for Statistical Significance is used to evaluate the trend<br>over 4 to 10 periods of measure, subject to data availability and comparability.
HP 2030 Target
(5.0)
<div>MICH-02: Reduce the rate of infant deaths <strong>(LEADING HEALTH INDICATOR)</strong></div>
NJ 2020
(4.8)
<div><span>Infant mortality rate continues to be one of the most widely used indicators of the overall health status of a community. The leading causes of death among infants are birth defects, pre-term delivery, low birth weight, Sudden Infant Death Syndrome (SIDS), and maternal complications during pregnancy.</span></div>
County: Morris Mothers who Received Early Prenatal Care
County: Morris Mothers who Received Early Prenatal Care
82.6%
(2021)
Compared to:

NJ Counties
The distribution is based on data from 21 New Jersey counties.
NJ Value
(74.9%)
The regional value is compared to the New Jersey State value.
US Value
(78.3%)
The regional value is compared to the national value. The source for the national value is Centers for Disease Control and Prevention
Prior Value
(84.5%)
Prior Value compares a measured value with the previously measured value. Confidence intervals were taken into account in determining the direction of the comparison.
Trend
This comparison measures the indicator’s values over multiple time periods.<br>The Mann-Kendall Test for Statistical Significance is used to evaluate the trend<br>over 4 to 10 periods of measure, subject to data availability and comparability.
NJ 2020
(79.4%)
<div><span><span>Babies born to mothers who do not receive prenatal care are three times more likely to have a low birth weight and five times more likely to die than those born to mothers who do get care. Early prenatal care (i.e. care in the first trimester of a pregnancy) allows women and their health care providers to identify and, when possible, treat or correct health problems and health-compromising behaviors that can be particularly damaging during the initial stages of fetal development. Increasing the number of women who receive prenatal care, and who do so early in their pregnancies, can improve birth outcomes and lower health care costs by reducing the likelihood of complications during pregnancy and childbirth.</span></span></div>
County: Morris Mothers who Received No Prenatal Care
County: Morris Mothers who Received No Prenatal Care
0.9%
(2021)
Compared to:

NJ Counties
The distribution is based on data from 21 New Jersey counties.
NJ Value
(1.8%)
The regional value is compared to the New Jersey State value.
US Value
(1.9% in 2020)
The regional value is compared to the national value. The source for the national value is Centers for Disease Control and Prevention
Prior Value
(1.0%)
Prior Value compares a measured value with the previously measured value. Confidence intervals were taken into account in determining the direction of the comparison.
Trend
This comparison measures the indicator’s values over multiple time periods.<br>The Mann-Kendall Test for Statistical Significance is used to evaluate the trend<br>over 4 to 10 periods of measure, subject to data availability and comparability.
County: Morris Preterm Births
County: Morris Preterm Births
7.7%
(2021)
Compared to:
NJ Counties
The distribution is based on data from 21 New Jersey counties.
NJ Value
(9.2%)
The regional value is compared to the New Jersey State value.
US Value
(12.0% in 2020)
The regional value is compared to the national value. The source for the national value is Centers for Disease Control and Prevention
Prior Value
(8.4%)
Prior Value compares a measured value with the previously measured value. Confidence intervals were taken into account in determining the direction of the comparison.
Trend
This comparison measures the indicator’s values over multiple time periods.<br>The Mann-Kendall Test for Statistical Significance is used to evaluate the trend<br>over 4 to 10 periods of measure, subject to data availability and comparability.
HP 2030 Target
(9.4%)
County: Morris Teen Birth Rate: 15-17
County: Morris Teen Birth Rate: 15-17
2.4
Live births per 1,000 females aged 15-17
(2010)
Compared to:
NJ Value
(10.0)
The regional value is compared to the New Jersey State value.
US Value
(17.3)
The regional value is compared to the national value. The source for the national value is Centers for Disease Control and Prevention, National Center for Health Statistics
Prior Value
(2.4)
Prior Value compares a measured value with the previously measured value. Confidence intervals were taken into account in determining the direction of the comparison.
County: Morris Very Preterm Births
County: Morris Very Preterm Births
1.0%
(2021)
Compared to:
NJ Counties
The distribution is based on data from 21 New Jersey counties.
NJ Value
(1.3%)
The regional value is compared to the New Jersey State value.
Prior Value
(0.9%)
Prior Value compares a measured value with the previously measured value. Confidence intervals were taken into account in determining the direction of the comparison.
Trend
This comparison measures the indicator’s values over multiple time periods.<br>The Mann-Kendall Test for Statistical Significance is used to evaluate the trend<br>over 4 to 10 periods of measure, subject to data availability and comparability.
County: Morris WIC Certified Stores
County: Morris WIC Certified Stores
0.1
Stores per 1,000 population
(2016)
Compared to:
NJ Counties
The distribution is based on data from 21 New Jersey counties.
U.S. Counties
The distribution is based on data from 2,981 U.S. counties and county equivalents.
