Advanced Search: Build a Custom Dashboard
In the fields below, search for indicators by location, topics, population, classification, subgroup, or comparison. No fields are required, but we suggest selecting a location or two to start. In the additional search options section, select options to group and order search results. To learn more about how to customize a dashboard, see our help center.
Visit the Indicator List Page to see the full list of indicators and locations available on the site.
Search Results:
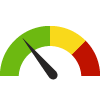
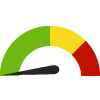
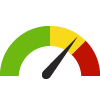
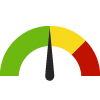
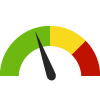
Indicator Gauge Icon Legend
Legend Colors
Red is bad, green is good, blue is not statistically different/neutral.
Compared to Distribution
 the value is in the best half of communities.
 the value is in the 2nd worst quarter of communities.
 the value is in the worst quarter of communities.
Compared to Target
 meets target;
  does not meet target.
Compared to a Single Value
 lower than the comparison value;
 higher than the comparison value;
 not statistically different from comparison value.
Trend

 non-significant change over time;
 significant change over time;
  no change over time.
Compared to Prior Value
 higher than the previous measurement period;
 lower than the previous measurement period;
 no statistically different change from previous measurement period.
Environmental Health / Air
Environmental Health / Air
County: Morris
Value
Compared to:
County: Morris Annual Ozone Air Quality
County: Morris Annual Ozone Air Quality
1
(2019-2021)
Compared to:

Air Quality Index
The American Lung Association (ALA) assigns grades A-F to counties (A=1; B=2; C=3; D=4; F=5), based on average annual number of days that ozone levels exceeded U.S. standards during the three year measurement period. The five-point grading scale was used for the distribution (Green = <2; Yellow = 2 - 3; Red = >3). The air quality data is collected by the EPA and summarized by the ALA.
Prior Value
(3)
Prior Value compares a measured value with the previously measured value. Confidence intervals were not taken into account in determining the direction of the comparison.
Trend
This comparison measures the indicator’s values over multiple time periods.<br>The Mann-Kendall Test for Statistical Significance is used to evaluate the trend<br>over 4 to 10 periods of measure, subject to data availability and comparability.
County: Morris Annual Particle Pollution
County: Morris Annual Particle Pollution
1
(2019-2021)
Compared to:
Air Quality Index
The American Lung Association (ALA) assigns grades A-F to counties (A=1; B=2; C=3; D=4; F=5), based on average annual number of days that particle pollution levels exceeded U.S. standards during the three year measurement period. The five-point grading scale was used for the distribution (Green = <2; Yellow = 2 - 3; Red = >3). The air quality data is collected by the EPA and summarized by the ALA.
Prior Value
(1)
Prior Value compares a measured value with the previously measured value. Confidence intervals were not taken into account in determining the direction of the comparison.
Trend
This comparison measures the indicator’s values over multiple time periods.<br>The Mann-Kendall Test for Statistical Significance is used to evaluate the trend<br>over 4 to 10 periods of measure, subject to data availability and comparability.
County: Morris Recognized Carcinogens Released into Air
County: Morris Recognized Carcinogens Released into Air
10,876
Pounds
(2022)
Compared to:

Prior Value
(16,172)
Prior Value compares a measured value with the previously measured value. Confidence intervals were not taken into account in determining the direction of the comparison.
Trend
This comparison measures the indicator’s values over multiple time periods.<br>The Mann-Kendall Test for Statistical Significance is used to evaluate the trend<br>over 4 to 10 periods of measure, subject to data availability and comparability.
Environmental Health / Built Environment
Environmental Health / Built Environment
County: Morris
Value
Compared to:
County: Morris Access to Exercise Opportunities
County: Morris Access to Exercise Opportunities
98.6%
(2024)
Compared to:
NJ Counties
The distribution is based on data from 21 New Jersey counties.
U.S. Counties
The distribution is based on data from 3,096 U.S. counties and county equivalents.
NJ Value
(96.3%)
The regional value is compared to the New Jersey State value.
US Value
(84.1%)
The regional value is compared to the national value.
Prior Value
(98.5%)
Prior Value compares a measured value with the previously measured value. Confidence intervals were not taken into account in determining the direction of the comparison.
County: Morris Access to Parks
County: Morris Access to Parks
1.0%
(2020)
Compared to:

NJ Counties
The distribution is based on data from 21 New Jersey counties.
NJ Value
(89.8%)
The regional value is compared to the New Jersey State value.
Prior Value
(0.9%)
Prior Value compares a measured value with the previously measured value. Confidence intervals were not taken into account in determining the direction of the comparison.
County: Morris Children with Low Access to a Grocery Store
County: Morris Children with Low Access to a Grocery Store
8.6%
(2015)
Compared to:
NJ Counties
The distribution is based on data from 21 New Jersey counties.
U.S. Counties
The distribution is based on data from 3,123 U.S. counties and county equivalents.
Prior Value
(9.4%)
Prior Value compares a measured value with the previously measured value. Confidence intervals were not taken into account in determining the direction of the comparison.
County: Morris Farmers Market Density
County: Morris Farmers Market Density
0.03
Markets per 1,000 population
(2018)
Compared to:
US Value
(0.03 in 2016)
The regional value is compared to the median value of 3,143 U.S. counties and county equivalents.
Prior Value
(0.03)
Prior Value compares a measured value with the previously measured value. Confidence intervals were not taken into account in determining the direction of the comparison.
Trend
This comparison measures the indicator’s values over multiple time periods.<br>The Mann-Kendall Test for Statistical Significance is used to evaluate the trend<br>over 4 to 10 periods of measure, subject to data availability and comparability.
County: Morris Fast Food Restaurant Density
County: Morris Fast Food Restaurant Density
0.80
Restaurants per 1,000 population
(2016)
Compared to:

NJ Counties
The distribution is based on data from 21 New Jersey counties.
U.S. Counties
The distribution is based on data from 3,143 U.S. counties and county equivalents.
Prior Value
(0.83)
Prior Value compares a measured value with the previously measured value. Confidence intervals were not taken into account in determining the direction of the comparison.
Trend
This comparison measures the indicator’s values over multiple time periods.<br>The Mann-Kendall Test for Statistical Significance is used to evaluate the trend<br>over 4 to 10 periods of measure, subject to data availability and comparability.
County: Morris Food Environment Index
County: Morris Food Environment Index
9.3
(2024)
Compared to:
NJ Counties
The distribution is based on data from 21 New Jersey counties.
U.S. Counties
The distribution is based on data from 3,108 U.S. counties and county equivalents.
NJ Value
(9.0)
The regional value is compared to the New Jersey State value.
US Value
(7.7)
The regional value is compared to the national value.
Prior Value
(9.1)
Prior Value compares a measured value with the previously measured value. Confidence intervals were not taken into account in determining the direction of the comparison.
Trend
This comparison measures the indicator’s values over multiple time periods.<br>The Mann-Kendall Test for Statistical Significance is used to evaluate the trend<br>over 4 to 10 periods of measure, subject to data availability and comparability.
County: Morris Grocery Store Density
County: Morris Grocery Store Density
0.20
Stores per 1,000 population
(2016)
Compared to:


NJ Counties
The distribution is based on data from 21 New Jersey counties.
U.S. Counties
The distribution is based on data from 3,143 U.S. counties and county equivalents.
Prior Value
(0.21)
Prior Value compares a measured value with the previously measured value. Confidence intervals were not taken into account in determining the direction of the comparison.
Trend
This comparison measures the indicator’s values over multiple time periods.<br>The Mann-Kendall Test for Statistical Significance is used to evaluate the trend<br>over 4 to 10 periods of measure, subject to data availability and comparability.
County: Morris Households with No Car and Low Access to a Grocery Store
County: Morris Households with No Car and Low Access to a Grocery Store
1.3%
(2015)
Compared to:
NJ Counties
The distribution is based on data from 21 New Jersey counties.
U.S. Counties
The distribution is based on data from 3,140 U.S. counties and county equivalents.
Prior Value
(1.7%)
Prior Value compares a measured value with the previously measured value. Confidence intervals were not taken into account in determining the direction of the comparison.
County: Morris Liquor Store Density
County: Morris Liquor Store Density
18.8
Stores per 100,000 population
(2021)
Compared to:


NJ Counties
The distribution is based on data from 21 New Jersey counties.
U.S. Counties
The distribution is based on data from 1,477 U.S. counties and county equivalents.
NJ Value
(19.5)
The regional value is compared to the New Jersey State value.
US Value
(10.7)
The regional value is compared to the national value.
Prior Value
(18.7)
Prior Value compares a measured value with the previously measured value. Confidence intervals were not taken into account in determining the direction of the comparison.
Trend
This comparison measures the indicator’s values over multiple time periods.<br>The Mann-Kendall Test for Statistical Significance is used to evaluate the trend<br>over 4 to 10 periods of measure, subject to data availability and comparability.
County: Morris Low-Income and Low Access to a Grocery Store
County: Morris Low-Income and Low Access to a Grocery Store
3.5%
(2015)
Compared to:
NJ Counties
The distribution is based on data from 21 New Jersey counties.
U.S. Counties
The distribution is based on data from 3,123 U.S. counties and county equivalents.
Prior Value
(3.2%)
Prior Value compares a measured value with the previously measured value. Confidence intervals were not taken into account in determining the direction of the comparison.
County: Morris Overcrowded Households
County: Morris Overcrowded Households
1.7%
(2018-2022)
Compared to:
NJ Counties
The distribution is based on data from 21 New Jersey counties.
NJ Value
(3.6%)
The regional value is compared to the New Jersey State value.
US Value
(3.4%)
The regional value is compared to the national value.
Trend
This comparison measures the indicator’s values over multiple time periods.<br>The Mann-Kendall Test for Statistical Significance is used to evaluate the trend<br>over 4 to 10 periods of measure, subject to data availability and comparability.
County: Morris People 65+ with Low Access to a Grocery Store
County: Morris People 65+ with Low Access to a Grocery Store
4.5%
(2015)
Compared to:
NJ Counties
The distribution is based on data from 21 New Jersey counties.
U.S. Counties
The distribution is based on data from 3,123 U.S. counties and county equivalents.
Prior Value
(5.6%)
Prior Value compares a measured value with the previously measured value. Confidence intervals were not taken into account in determining the direction of the comparison.
County: Morris Proximity to Highways
County: Morris Proximity to Highways
0.1%
(2020)
Compared to:

NJ Counties
The distribution is based on data from 21 New Jersey counties.
NJ Value
(0.1%)
The regional value is compared to the New Jersey State value.
Prior Value
(0.1%)
Prior Value compares a measured value with the previously measured value. Confidence intervals were not taken into account in determining the direction of the comparison.
County: Morris Recreation and Fitness Facilities
County: Morris Recreation and Fitness Facilities
0.25
Facilities per 1,000 population
(2016)
Compared to:
US Value
(0.06 in 2014)
The regional value is compared to the median value of 3,143 U.S. counties and county equivalents.
Prior Value
(0.24)
Prior Value compares a measured value with the previously measured value. Confidence intervals were not taken into account in determining the direction of the comparison.
Trend
This comparison measures the indicator’s values over multiple time periods.<br>The Mann-Kendall Test for Statistical Significance is used to evaluate the trend<br>over 4 to 10 periods of measure, subject to data availability and comparability.
County: Morris Severe Housing Problems
County: Morris Severe Housing Problems
14.8%
(2016-2020)
Compared to:
NJ Counties
The distribution is based on data from 21 New Jersey counties.
U.S. Counties
The distribution is based on data from 3,141 U.S. counties and county equivalents.
NJ Value
(19.8%)
The regional value is compared to the New Jersey State value.
US Value
(16.7%)
The regional value is compared to the national value.
Prior Value
(15.0%)
Prior Value compares a measured value with the previously measured value. Confidence intervals were taken into account in determining the direction of the comparison.
Trend
This comparison measures the indicator’s values over multiple time periods.<br>The Mann-Kendall Test for Statistical Significance is used to evaluate the trend<br>over 4 to 10 periods of measure, subject to data availability and comparability.
County: Morris WIC Certified Stores
County: Morris WIC Certified Stores
0.1
Stores per 1,000 population
(2016)
Compared to:
NJ Counties
The distribution is based on data from 21 New Jersey counties.
U.S. Counties
The distribution is based on data from 2,981 U.S. counties and county equivalents.
Environmental Health / Toxins & Contaminants
Environmental Health / Toxins & Contaminants
County: Morris
Value
Compared to:
County: Morris Adults with Current Asthma
County: Morris Adults with Current Asthma
9.7%
(2021)
Compared to:
NJ Counties
The distribution is based on data from 21 New Jersey counties.
NJ Value
(9.2%)
The regional value is compared to the New Jersey State value.
US Value
(9.8%)
The regional value is compared to the national value. The source for the national value is Behavioral Risk Factor Surveillance System
Prior Value
(4.8%)
Prior Value compares a measured value with the previously measured value. Confidence intervals were taken into account in determining the direction of the comparison.
Trend
This comparison measures the indicator’s values over multiple time periods.<br>The Mann-Kendall Test for Statistical Significance is used to evaluate the trend<br>over 4 to 10 periods of measure, subject to data availability and comparability.
County: Morris Asthma: Medicare Population
County: Morris Asthma: Medicare Population
6.0%
(2022)
Compared to:
NJ Counties
The distribution is based on data from 21 New Jersey counties.
U.S. Counties
The distribution is based on data from 3,129 U.S. counties and county equivalents.
NJ Value
(7.0%)
The regional value is compared to the New Jersey State value.
US Value
(7.0%)
The regional value is compared to the national value.
Prior Value
(6.0%)
Prior Value compares a measured value with the previously measured value. Confidence intervals were not taken into account in determining the direction of the comparison.
Trend
This comparison measures the indicator’s values over multiple time periods.<br>The Mann-Kendall Test for Statistical Significance is used to evaluate the trend<br>over 4 to 10 periods of measure, subject to data availability and comparability.
County: Morris Blood Lead Levels in Children (>=5 micrograms per deciliter)
County: Morris Blood Lead Levels in Children (>=5 micrograms per deciliter)
1.1%
(2016)
Compared to:
NJ Counties
(2015)
The distribution is based on data from 20 New Jersey counties.
NJ Value
(2.2%)
The regional value is compared to the New Jersey State value.
Prior Value
(1.0%)
Prior Value compares a measured value with the previously measured value. Confidence intervals were not taken into account in determining the direction of the comparison.
Trend
This comparison measures the indicator’s values over multiple time periods.<br>The Mann-Kendall Test for Statistical Significance is used to evaluate the trend<br>over 4 to 10 periods of measure, subject to data availability and comparability.
County: Morris PBT Released
County: Morris PBT Released
169
Pounds
(2022)
Compared to:
Prior Value
(624)
Prior Value compares a measured value with the previously measured value. Confidence intervals were not taken into account in determining the direction of the comparison.
Trend
This comparison measures the indicator’s values over multiple time periods.<br>The Mann-Kendall Test for Statistical Significance is used to evaluate the trend<br>over 4 to 10 periods of measure, subject to data availability and comparability.
County: Morris Physical Environment Ranking
County: Morris Physical Environment Ranking
2
(2023)
Compared to:
NJ Counties
The distribution is based on data from 21 New Jersey counties.
County: Morris Risk factor for childhood lead exposure: Pre-1950 Housing
County: Morris Risk factor for childhood lead exposure: Pre-1950 Housing
20.5%
% Housing units built pre-1950
(2015)
Compared to:
NJ Value
(26.0%)
The regional value is compared to the percent of pre-1950 housing units out of all resident housing in the state.
Prior Value
(19.3%)
Prior Value compares a measured value with the previously measured value. Confidence intervals were not taken into account in determining the direction of the comparison.
Environmental Health / Weather & Climate
Environmental Health / Weather & Climate
County: Morris
Value
Compared to:
County: Morris Daily Dose of UV Irradiance
County: Morris Daily Dose of UV Irradiance
3,042.0
Joule per square meter
(2020)
Compared to:
NJ Counties
The distribution is based on data from 21 New Jersey counties.
NJ Value
(3,264.0)
The regional value is compared to the New Jersey State value.
Prior Value
(3,212.0)
Prior Value compares a measured value with the previously measured value. Confidence intervals were not taken into account in determining the direction of the comparison.
Trend
This comparison measures the indicator’s values over multiple time periods.<br>The Mann-Kendall Test for Statistical Significance is used to evaluate the trend<br>over 4 to 10 periods of measure, subject to data availability and comparability.
County: Morris Months of Mild Drought or Worse
County: Morris Months of Mild Drought or Worse
7
Months per year
(2016)
Compared to:
Prior Value
(8)
Prior Value compares a measured value with the previously measured value. Confidence intervals were not taken into account in determining the direction of the comparison.
Trend
This comparison measures the indicator’s values over multiple time periods.<br>The Mann-Kendall Test for Statistical Significance is used to evaluate the trend<br>over 4 to 10 periods of measure, subject to data availability and comparability.
County: Morris Number of Extreme Heat Days
County: Morris Number of Extreme Heat Days
19
Days
(2022)
Compared to:
Prior Value
(19)
Prior Value compares a measured value with the previously measured value. Confidence intervals were not taken into account in determining the direction of the comparison.
Trend
This comparison measures the indicator’s values over multiple time periods.<br>The Mann-Kendall Test for Statistical Significance is used to evaluate the trend<br>over 4 to 10 periods of measure, subject to data availability and comparability.
County: Morris Number of Extreme Heat Events
County: Morris Number of Extreme Heat Events
18
Events
(2022)
Compared to:
Prior Value
(15)
Prior Value compares a measured value with the previously measured value. Confidence intervals were not taken into account in determining the direction of the comparison.
Trend
This comparison measures the indicator’s values over multiple time periods.<br>The Mann-Kendall Test for Statistical Significance is used to evaluate the trend<br>over 4 to 10 periods of measure, subject to data availability and comparability.
County: Morris Number of Extreme Precipitation Days
County: Morris Number of Extreme Precipitation Days
2
Days
(2023)
Compared to:
Prior Value
(19)
Prior Value compares a measured value with the previously measured value. Confidence intervals were not taken into account in determining the direction of the comparison.
Trend
This comparison measures the indicator’s values over multiple time periods.<br>The Mann-Kendall Test for Statistical Significance is used to evaluate the trend<br>over 4 to 10 periods of measure, subject to data availability and comparability.
County: Morris Weeks of Moderate Drought or Worse
County: Morris Weeks of Moderate Drought or Worse
0
Weeks per year
(2021)
Compared to:
Prior Value
Prior Value compares a measured value with the previously measured value. Confidence intervals were not taken into account in determining the direction of the comparison.
Trend
This comparison measures the indicator’s values over multiple time periods.<br>The Mann-Kendall Test for Statistical Significance is used to evaluate the trend<br>over 4 to 10 periods of measure, subject to data availability and comparability.
