Advanced Search: Build a Custom Dashboard
In the fields below, search for indicators by location, topics, population, classification, subgroup, or comparison. No fields are required, but we suggest selecting a location or two to start. In the additional search options section, select options to group and order search results. To learn more about how to customize a dashboard, see our help center.
Visit the Indicator List Page to see the full list of indicators and locations available on the site.
Search Results:
Indicator Gauge Icon Legend
Legend Colors
Red is bad, green is good, blue is not statistically different/neutral.
Compared to Distribution
 the value is in the best half of communities.
 the value is in the 2nd worst quarter of communities.
 the value is in the worst quarter of communities.
Compared to Target
 meets target;
  does not meet target.
Compared to a Single Value
 lower than the comparison value;
 higher than the comparison value;
 not statistically different from comparison value.
Trend

 non-significant change over time;
 significant change over time;
  no change over time.
Compared to Prior Value
 higher than the previous measurement period;
 lower than the previous measurement period;
 no statistically different change from previous measurement period.
Health / Diabetes
Health / Diabetes
County: Morris
Value
Compared to:
County: Morris Adults 20+ with Diabetes
County: Morris Adults 20+ with Diabetes
6.6%
(2021)
Compared to:
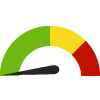
NJ Counties
The distribution is based on data from 21 New Jersey counties.
U.S. Counties
The distribution is based on data from 3,074 U.S. counties and county equivalents.
Prior Value
(6.2%)
Prior Value compares a measured value with the previously measured value. Confidence intervals were taken into account in determining the direction of the comparison.
Trend
This comparison measures the indicator’s values over multiple time periods.<br>The Mann-Kendall Test for Statistical Significance is used to evaluate the trend<br>over 4 to 10 periods of measure, subject to data availability and comparability.
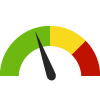
County: Morris Adults with Prediabetes
County: Morris Adults with Prediabetes
6.7%
(2017)
Compared to:

NJ Counties
The distribution is based on data from 21 New Jersey counties.
NJ Value
(9.4%)
The regional value is compared to the New Jersey State value.
Prior Value
(5.3%)
Prior Value compares a measured value with the previously measured value. Confidence intervals were taken into account in determining the direction of the comparison.
Trend
This comparison measures the indicator’s values over multiple time periods.<br>The Mann-Kendall Test for Statistical Significance is used to evaluate the trend<br>over 4 to 10 periods of measure, subject to data availability and comparability.
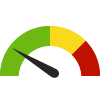
County: Morris Age-Adjusted Death Rate due to Diabetes
County: Morris Age-Adjusted Death Rate due to Diabetes
16.2
Deaths per 100,000 population
(2019-2021)
Compared to:
NJ Counties
The distribution is based on data from 21 New Jersey counties.
NJ Value
(18.5)
The regional value is compared to the New Jersey State value.
US Value
(24.8 in 2020)
The regional value is compared to the national value. The source for the national value is Centers for Disease Control and Prevention
Prior Value
(14.7)
Prior Value compares a measured value with the previously measured value. Confidence intervals were taken into account in determining the direction of the comparison.
NJ 2020
(15.8)
<div><span>Diabetes is a group of diseases marked by high levels of blood glucose, also called blood sugar, resulting from defects in insulin production, insulin action, or both. In 2007, diabetes was the seventh leading cause of death in the United States and an estimated 23.6 million people or 7.8% of the population had diabetes. The prevalence of diagnosed type 2 diabetes increased sixfold in the latter half of the last century. Diabetes risk factors such as obesity and physical inactivity have played a major role in this dramatic increase. Age, race, and ethnicity are also important risk factors. </span><br /><br /><span>Diabetes can have a harmful effect on most of the organ systems in the human body; it is a frequent cause of end-stage renal disease, non-traumatic lower-extremity amputation, and a leading cause of blindness among working age adults. Persons with diabetes are also at increased risk for ischemic heart disease, neuropathy, and stroke. In economic terms, the direct medical expenditure attributable to diabetes in 2007 was estimated to be $116 billion.</span></div>
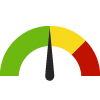
County: Morris Diabetes: Medicare Population
County: Morris Diabetes: Medicare Population
24.0%
(2022)
Compared to:
NJ Counties
The distribution is based on data from 21 New Jersey counties.
U.S. Counties
The distribution is based on data from 3,129 U.S. counties and county equivalents.
NJ Value
(28.0%)
The regional value is compared to the New Jersey State value.
US Value
(24.0%)
The regional value is compared to the national value.
Prior Value
(24.0%)
Prior Value compares a measured value with the previously measured value. Confidence intervals were not taken into account in determining the direction of the comparison.
Trend
This comparison measures the indicator’s values over multiple time periods.<br>The Mann-Kendall Test for Statistical Significance is used to evaluate the trend<br>over 4 to 10 periods of measure, subject to data availability and comparability.
County: Morris Diabetic Monitoring: Medicare Population
County: Morris Diabetic Monitoring: Medicare Population
88.2%
(2019)
Compared to:
NJ Counties
The distribution is based on data from 21 New Jersey counties.
U.S. Counties
The distribution is based on data from 3,097 U.S. counties and county equivalents.
NJ Value
(87.6%)
The regional value is compared to the New Jersey State value.
US Value
(87.5%)
The regional value is compared to the national value.
Prior Value
(88.3%)
Prior Value compares a measured value with the previously measured value. Confidence intervals were taken into account in determining the direction of the comparison.
Trend
This comparison measures the indicator’s values over multiple time periods.<br>The Mann-Kendall Test for Statistical Significance is used to evaluate the trend<br>over 4 to 10 periods of measure, subject to data availability and comparability.
