Indicator Gauge Icon Legend
Legend Colors
Red is bad, green is good, blue is not statistically different/neutral.
Compared to Distribution
 the value is in the best half of communities.
 the value is in the 2nd worst quarter of communities.
 the value is in the worst quarter of communities.
Compared to Target
 meets target;
  does not meet target.
Compared to a Single Value
 lower than the comparison value;
 higher than the comparison value;
 not statistically different from comparison value.
Trend

 non-significant change over time;
 significant change over time;
  no change over time.
Compared to Prior Value
 higher than the previous measurement period;
 lower than the previous measurement period;
 no statistically different change from previous measurement period.
 Significantly better than the overall value
 Significantly worse than the overall value
 No significant difference with the overall value
 No data on significance available
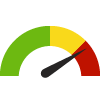
Adults with Pneumonia Vaccination
County: Morris
Measurement Period: 2021
This indicator is archived and is no longer being updated. Click to learn more
This indicator shows the percentage of adults who have ever received a pneumococcal (pneumonia) vaccine.
Why is this important?
Pneumococcal pneumonia is a serious condition characterized by high fever, cough, shortness of breath, and meningitis. It is a contagious disease and can be spread by respiratory secretions from coughing or sneezing. Pneumococcal pneumonia is the leading cause of vaccine-preventable death and illness in the United States--it kills about 1 out of every 20 people who develop the disease. The pneumococcal vaccine is very effective at preventing severe disease, hospitalization, and death. The Centers for Disease Control and Prevention (CDC) recommends the current vaccine for adults ages 65 years and older and for children ages 2 and older who are at high risk for disease.
Clear this location
County: Morris
21.3%
Source:
State of New Jersey Department of Health
Measurement period: 2021
Maintained by: Conduent Healthy Communities Institute
Last update: April 2024
Measurement period: 2021
Maintained by: Conduent Healthy Communities Institute
Last update: April 2024
Compared to


More details:
The NJBRFS dataset for 2018 is incomplete. There are no 2019 NJBRFS data due to data collection issues.
Graph Selections
No significant difference with the overall value

| County | Source | Measurement Period | Percent | |
|---|---|---|---|---|
There are 5 County values. The lowest value is 19.3%, and the highest value is 38.6%.
Half of the values are between 19.3% and 21.3%.
The middle (median) value is 21.3%.
Data Source
- State of New Jersey Department of Health
Maintained By: Conduent Healthy Communities Institute (Methodology)
Filed under: Health / Immunizations & Infectious Diseases, Health / Respiratory Diseases, Clinical Care, Adults