Indicator Gauge Icon Legend
Legend Colors
Red is bad, green is good, blue is not statistically different/neutral.
Compared to Distribution
 the value is in the best half of communities.
 the value is in the 2nd worst quarter of communities.
 the value is in the worst quarter of communities.
Compared to Target
 meets target;
  does not meet target.
Compared to a Single Value
 lower than the comparison value;
 higher than the comparison value;
 not statistically different from comparison value.
Trend

 non-significant change over time;
 significant change over time;
  no change over time.
Compared to Prior Value
 higher than the previous measurement period;
 lower than the previous measurement period;
 no statistically different change from previous measurement period.
 Significantly better than the overall value
 Significantly worse than the overall value
 No significant difference with the overall value
 No data on significance available
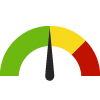
Kindergartners with Required Immunizations
County: Morris
Measurement Period: 2022-2023
This indicator is archived and is no longer being updated. Click to learn more
This indicator shows the percentage of enrolled kindergarten students that have received all required immunizations. Required immunizations include 4+ DTP, 3+ Polio, 2+ MMR, 3+ Hep B, and 1+ Var or physician documented varicella disease.
Why is this important?
Timely immunizations protect children from contracting and spreading communicable diseases such as measles, mumps, and whooping cough. These diseases can result in extended school absences, hospitalizations, and death. Childhood illnesses also have a significant financial impact on parents including costly medical bills and loss of work time. The immunization schedule changes frequently. For more information and the most up-to-date immunization schedule, refer to the Centers for Disease Control and Prevention's website on vaccines.
Clear this location
County: Morris
95.3%
Source:
State of New Jersey Department of Health
Measurement period: 2022-2023
Maintained by: Conduent Healthy Communities Institute
Last update: June 2023
Measurement period: 2022-2023
Maintained by: Conduent Healthy Communities Institute
Last update: June 2023
Compared to

Technical note: Values for previous years may not reflect the most recent revisions made by the State of New Jersey Department of Health. Please consult the source for the most current data.
Graph Selections

| County | Source | Measurement Period | Percent | |
|---|---|---|---|---|
There are 5 County values. The lowest value is 93.3%, and the highest value is 95.5%.
Half of the values are between 93.3% and 95.3%.
The middle (median) value is 95.3%.
Data Source
- State of New Jersey Department of Health
Maintained By: Conduent Healthy Communities Institute (Methodology)
Filed under: Health / Immunizations & Infectious Diseases, Health / Children's Health, Health Behaviors, Children